


Main Facts: A Tale of Two Markets
Today, global financial markets presented a striking dichotomy. As Wall Street indices surged—with the Nasdaq Composite climbing 1.4% and the S&P 500 gaining 0.8%—the digital asset market remained remarkably subdued. This divergence arrives at a critical juncture for both traditional equities and cryptocurrencies, fueled by a unique confluence of judicial intervention and geopolitical stabilization.
The primary drivers for the equity rally were twofold: a landmark Supreme Court ruling preventing the executive branch from unilaterally removing Federal Reserve Governor Lisa Cook, and a cooling of tensions near the Strait of Hormuz following a successful U.S.-Iran ceasefire agreement. While these developments provided the necessary tailwinds for traditional risk-on assets, Bitcoin (BTC) failed to capture the momentum.
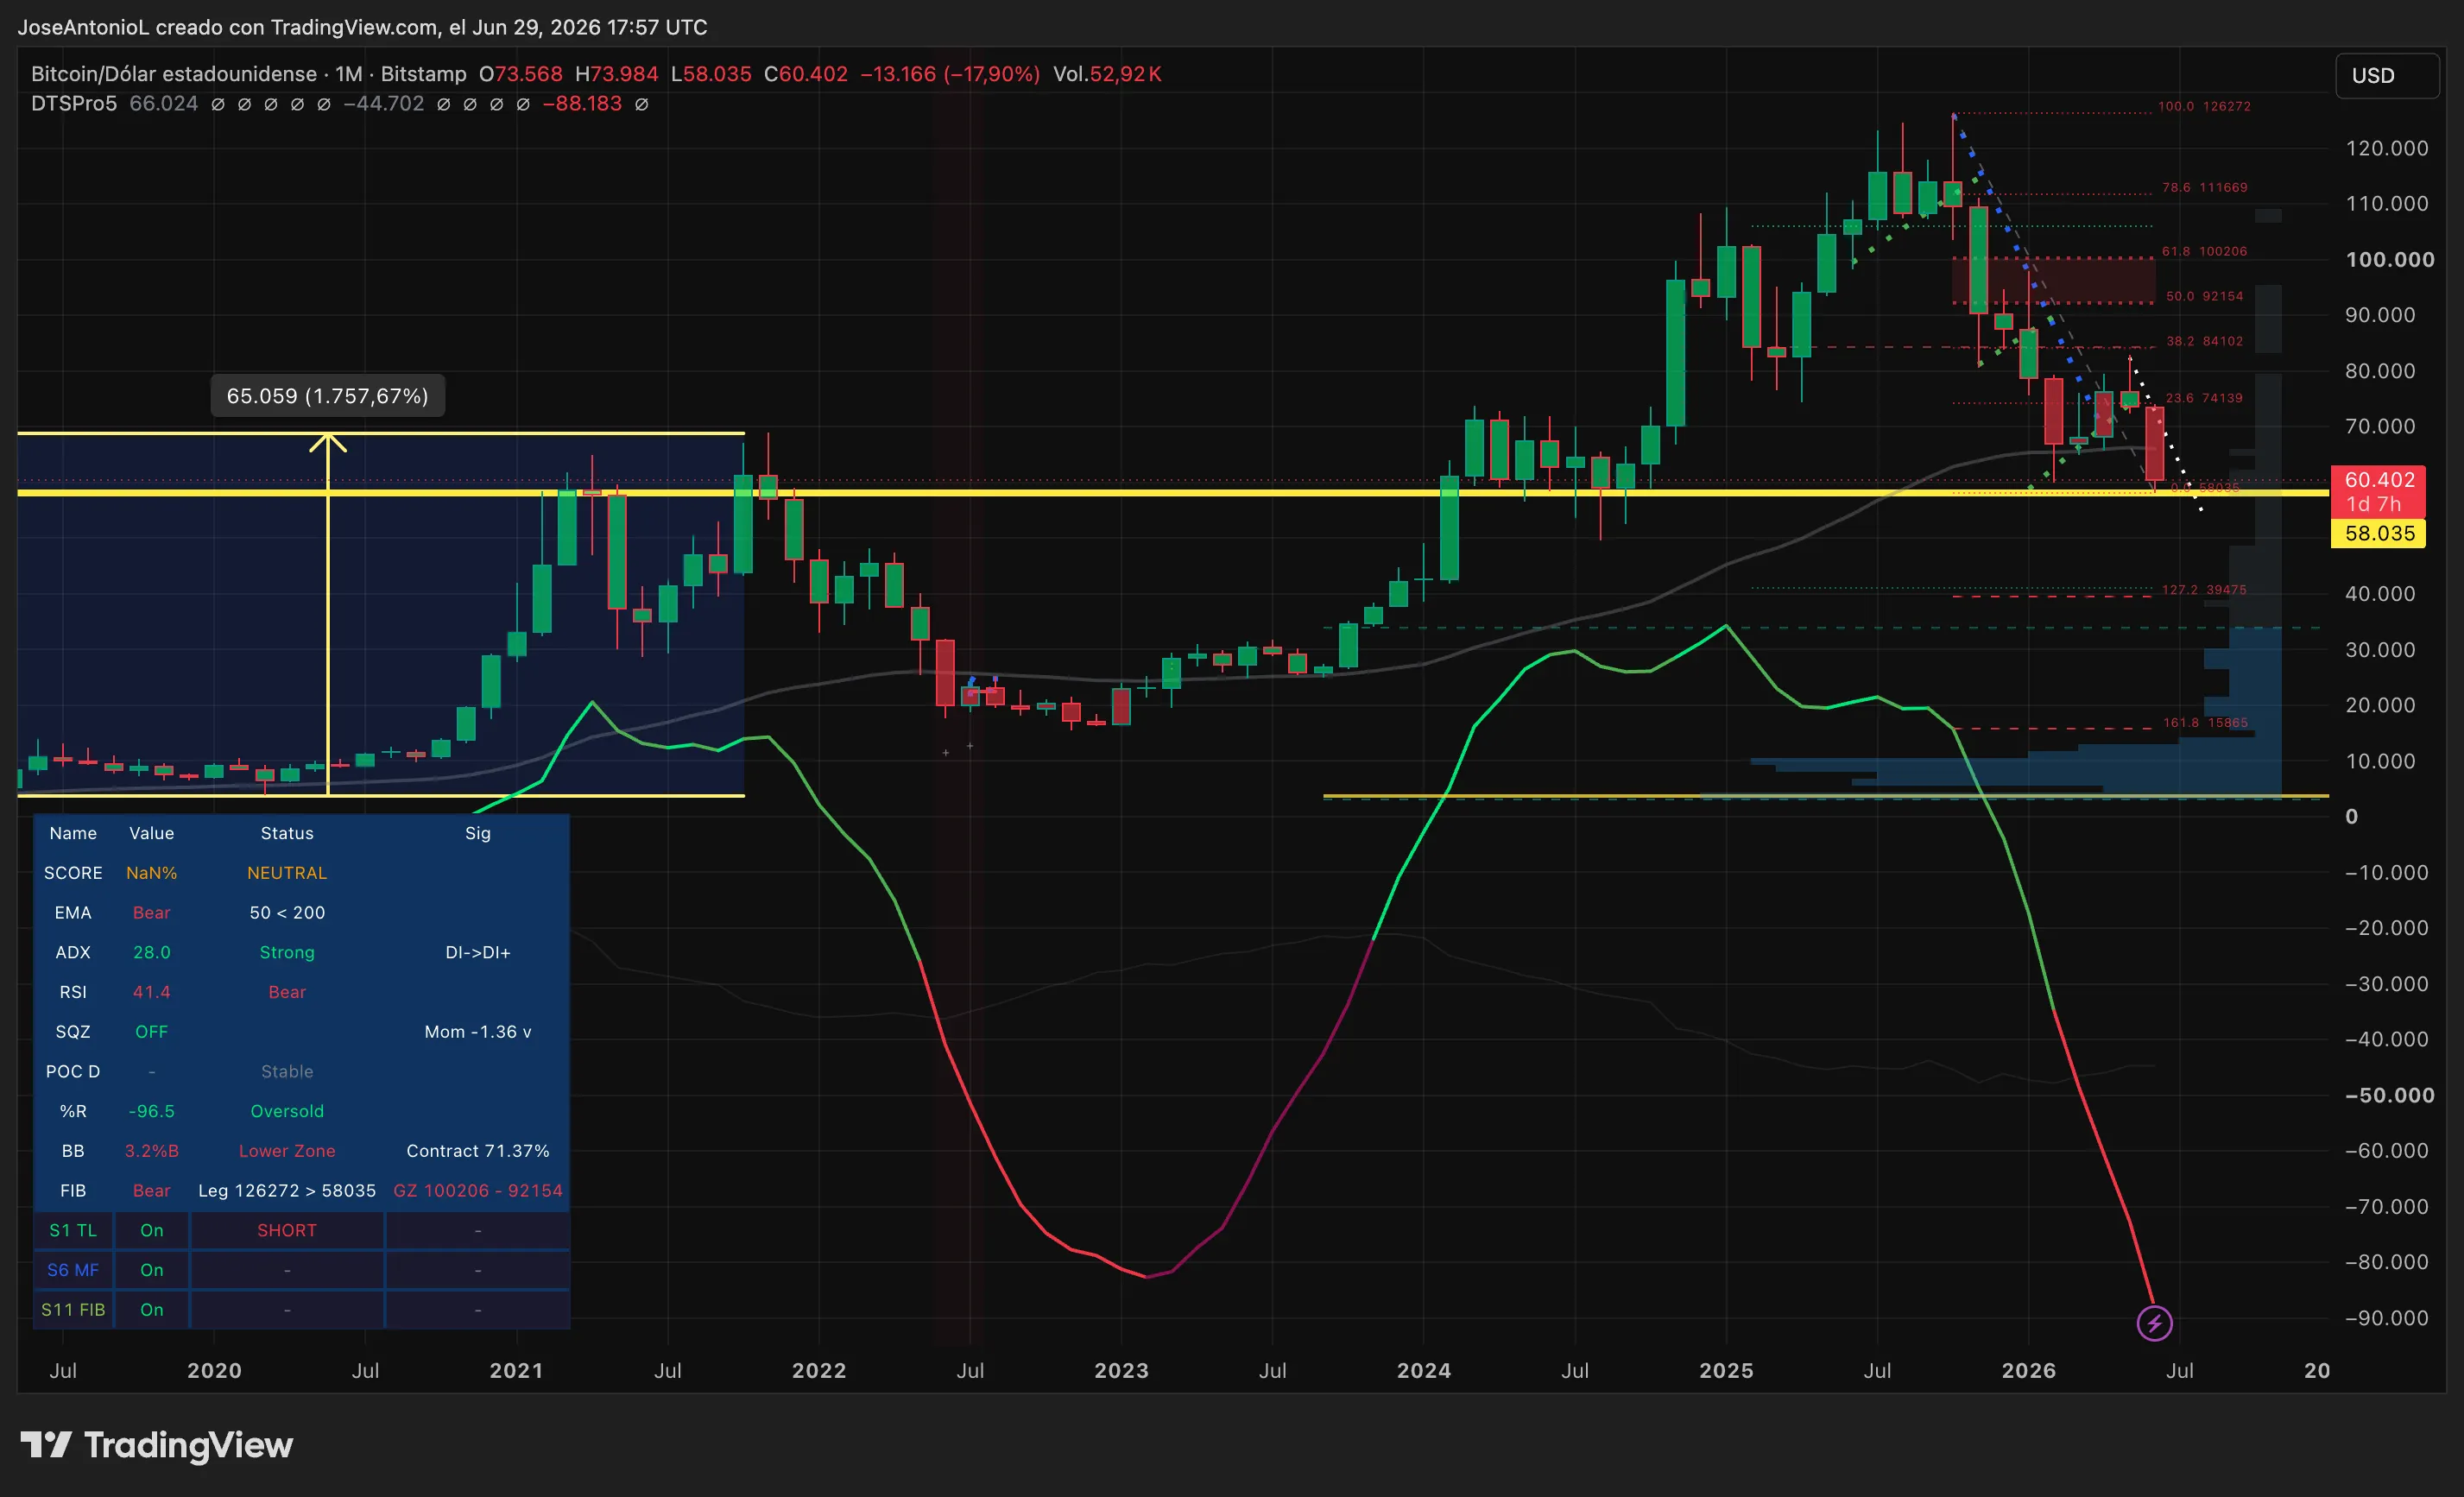
Currently, Bitcoin is languishing approximately 53% below its October 2025 all-time high of $126,198. The asset has just concluded a period of back-to-back quarterly losses, a performance metric that bears an unsettling resemblance to the punishing bear market of 2022. For the crypto-native investor, the "green" day on the S&P 500 is a grim reminder of the decoupling—or perhaps the lack of institutional confidence—currently plaguing the digital asset space.
Chronology: A Quarter Defined by Retrenchment
To understand the current state of Bitcoin, one must look at the timeline of the second quarter of 2026. Following a hopeful start to the year, the market sentiment soured as inflationary data remained sticky and the Federal Reserve, under the leadership of Kevin Warsh, maintained a distinctly hawkish stance.
- April–May 2026: Bitcoin attempted to sustain support above the $80,000 level, but institutional interest began to wane as bond yields rose, drawing liquidity away from speculative assets.
- June 2026: The exodus accelerated. Spot Bitcoin ETFs, which were once the primary engine of price appreciation, recorded net outflows totaling roughly $4 billion throughout the month. This institutional retreat removed the vital cushion that had protected Bitcoin from previous corrections.
- Late June 2026: The market saw a breakdown in structural support levels, leading to a series of daily price dips that tested the resolve of long-term holders.
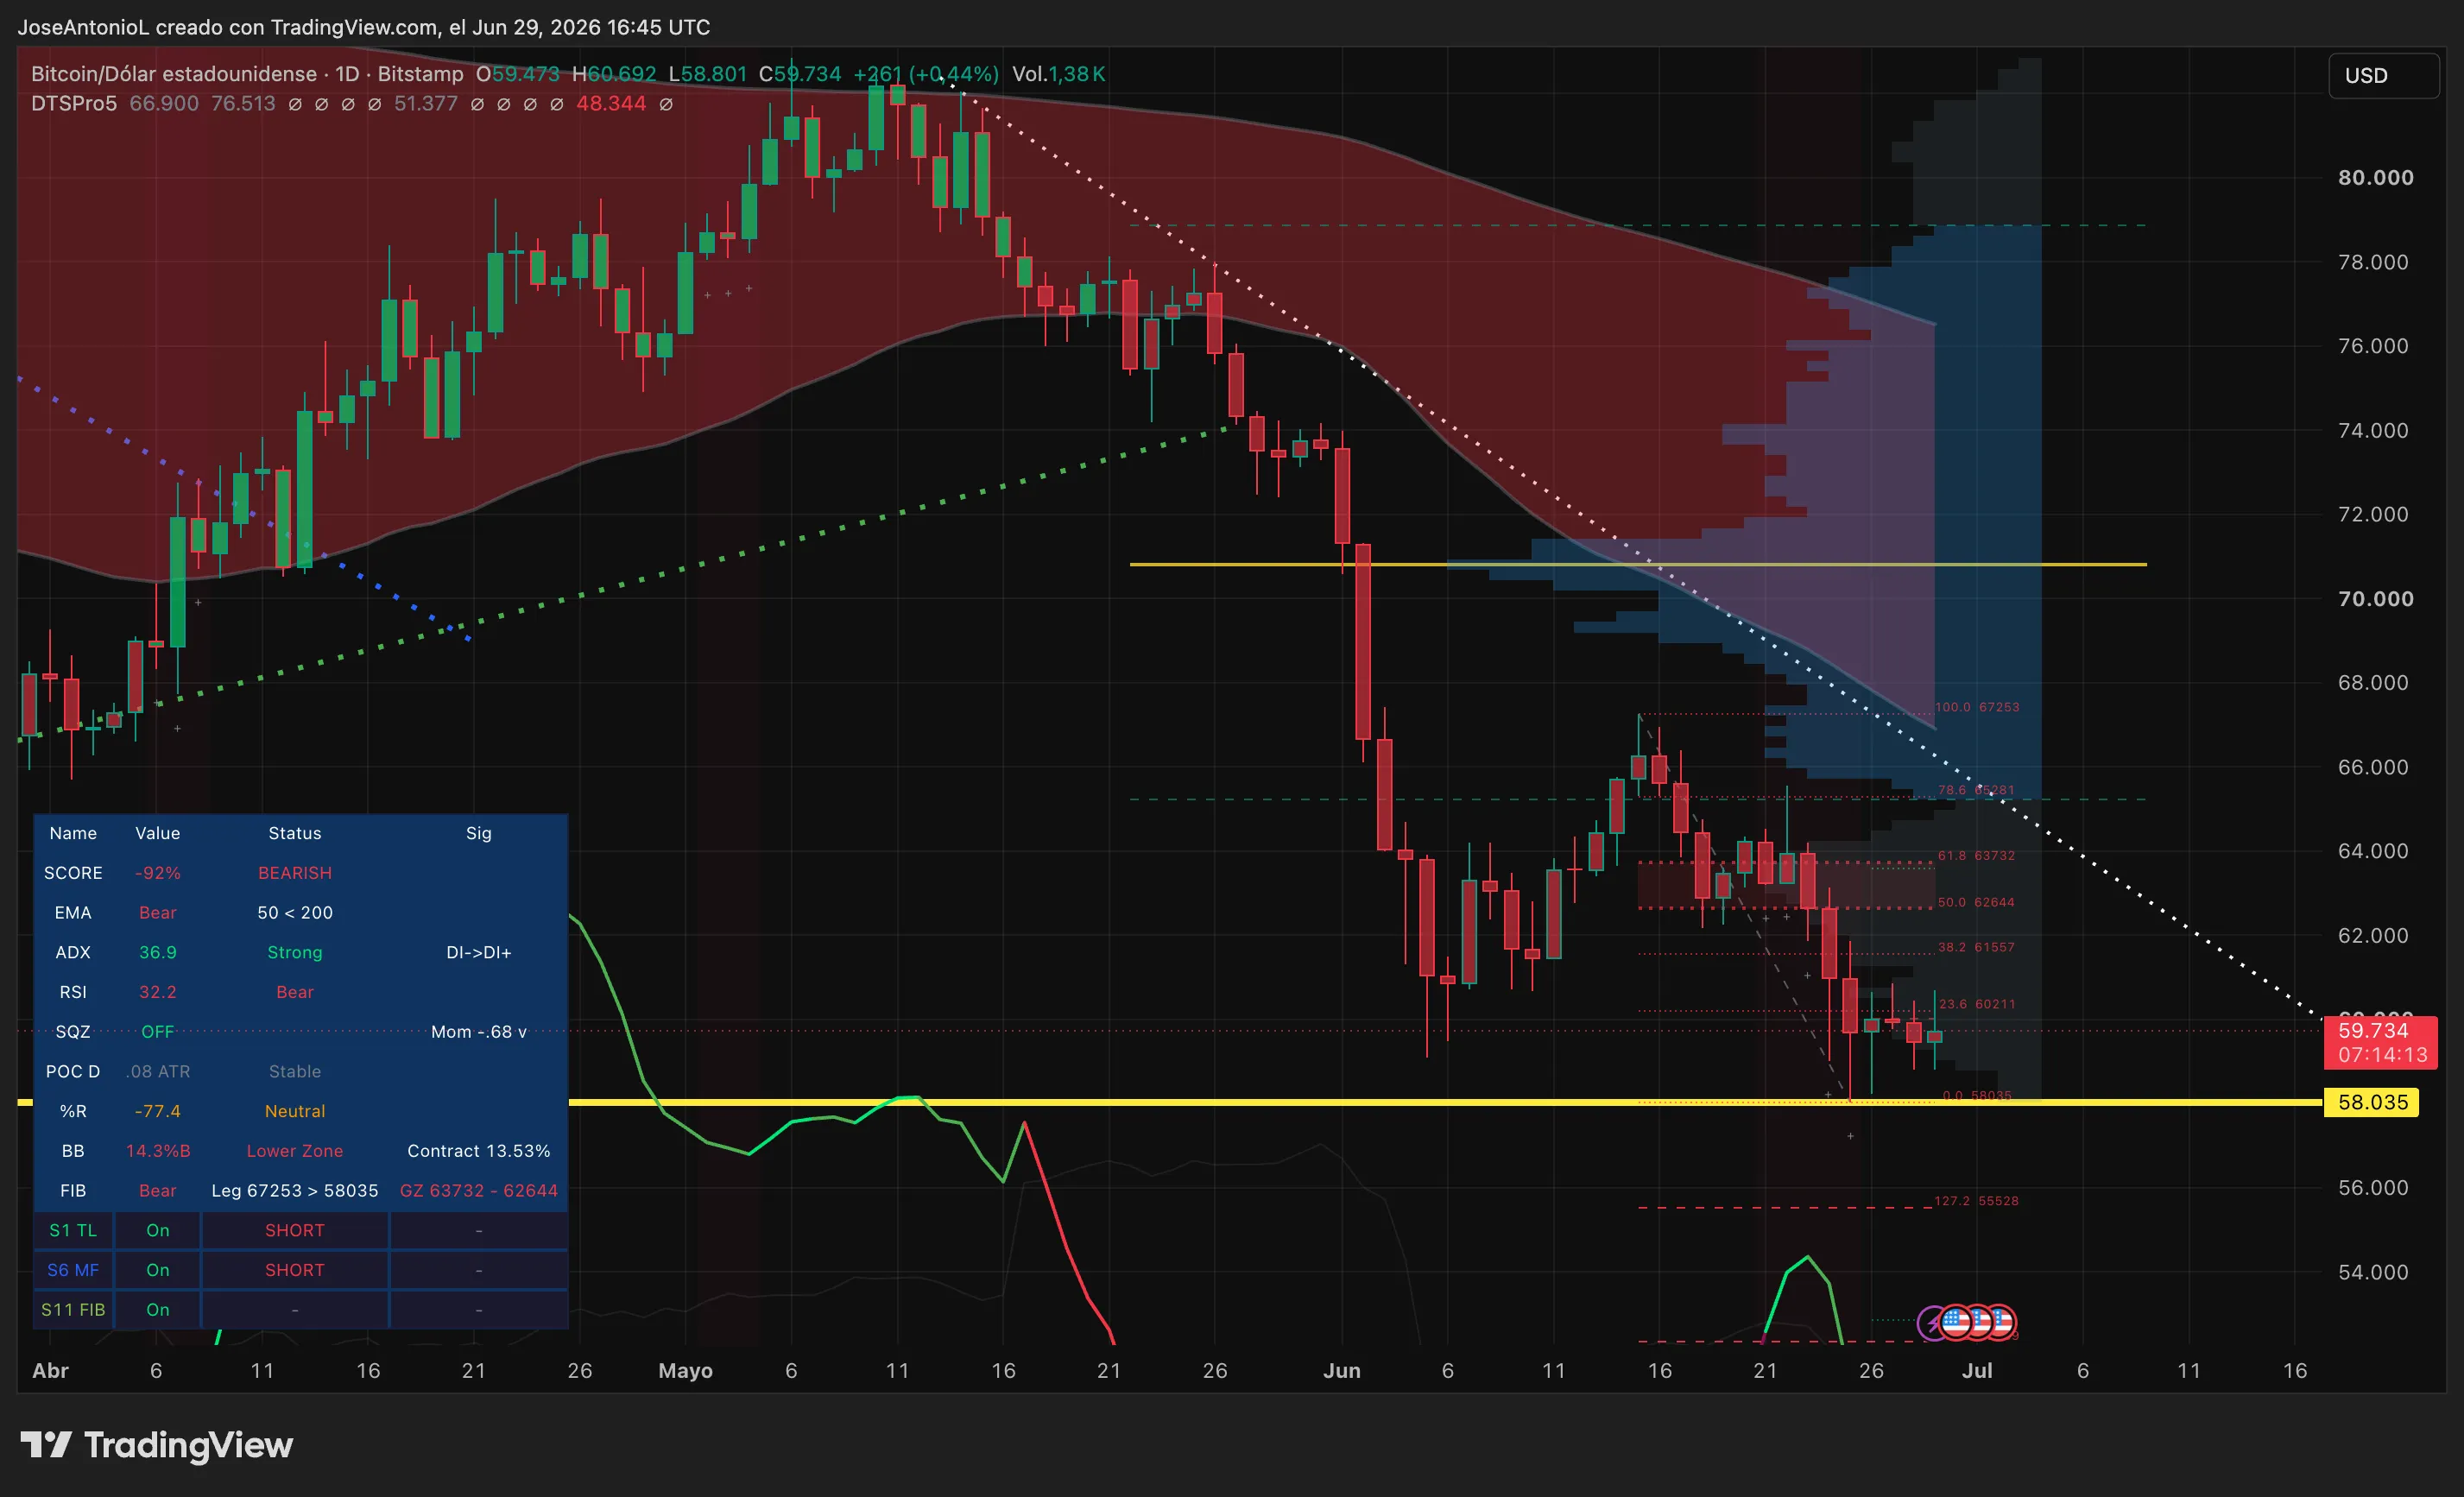
- Today: The market opened at $59,473, briefly touching a session low of $58,801 before a modest recovery brought the price to approximately $60,104—a 1.06% daily gain that many analysts view as a "dead cat bounce" rather than a trend reversal.
Supporting Data: Technical Indicators and Market Sentiment
A deep dive into the technical indicators reveals why the current recovery attempt lacks conviction.

The Daily Chart Analysis
Bitcoin is currently trading within a precarious range. The $58,035 price point serves as the anchor of the current bearish Fibonacci leg, measured from the June high of $67,253. While this level has acted as a temporary horizontal support, the frequency of retests is raising concerns among veteran traders.
The Average Directional Index (ADX) currently sits at 36.9. In technical analysis, an ADX above 25 signifies a strong, committed trend. Given the price action, this indicates that the bearish momentum is not merely a temporary fluctuation but a well-entrenched market direction. Furthermore, the Relative Strength Index (RSI) sits at 34. While this is approaching the "oversold" threshold of 30, it has not yet reached the point of capitulation that historically triggers massive short-covering rallies.
The Death Cross and Moving Averages
Perhaps most damaging to the bulls is the configuration of the exponential moving averages (EMAs). The 50-day EMA currently resides at $66,913, while the 200-day EMA sits significantly higher at $76,517. With the price trading below both and the 50-day trending below the 200-day, the market has confirmed a "death cross." This is a classic indicator of a long-term bearish outlook, suggesting that the path of least resistance remains firmly to the downside.
The Prediction Market Perspective
Sentiment on decentralized platforms like Myriad, the prediction market developed by Dastan, reflects this technical gloom. Traders are currently pricing in an 80% probability that Bitcoin will hit $55,000 before it sees a sustained move toward $84,000. This stark consensus among participants highlights a lack of institutional "buy-the-dip" conviction.
Official Responses and Macro Implications
The macro backdrop is arguably the most significant headwind for the cryptocurrency sector. Under the current Fed regime, interest rate policy has become the primary antagonist to speculative growth.
The Federal Reserve’s Stance
The market is currently pricing in an 80% probability of a rate hike in December. Kevin Warsh’s leadership at the Fed has signaled a commitment to fighting inflationary pressures with a rigor that many investors find uncomfortable. For Bitcoin, which historically thrives in a low-interest-rate environment, the prospect of further hikes acts as a persistent anchor on price potential.
The Supreme Court’s Intervention
The Supreme Court’s ruling to protect Governor Lisa Cook’s tenure is a significant constitutional development, but its impact on markets is indirect. By preventing the executive branch from removing a Fed governor, the Court has effectively signaled a desire for institutional stability and independence within the central bank. While this calmed volatility in equity markets, it solidified the expectation that the Fed will remain autonomous and committed to its current, hawkish inflation-targeting framework—a development that does little to help the liquidity-starved crypto markets.
Implications for the Future: Navigating the Compression
The short-term outlook for Bitcoin remains a game of "compression." On the four-hour chart, price action has been tightly bound between $59,200 and $60,400. This volatility squeeze offers opportunities for high-frequency traders, but it is a dangerous environment for long-term investors.
For those employing leverage, this $1,200 range represents a tactical opportunity. With 5x leverage, a disciplined trader could theoretically capture 21.1% on capital over a few cycles. However, this strategy is fragile; a break below the $59,200 support level would likely invalidate the trade and force a retest of the $55,528 support floor.
The Road to Recovery
For the bulls to reclaim the narrative, they must achieve several milestones:
- Hold the Line: The $58,035 support level must hold against further selling pressure.
- Reclaim the Golden Zone: A recovery must push into the Fibonacci Golden Zone ($62,644 to $63,732). Reclaiming this range is a prerequisite for any talk of a trend reversal.
- Breach the Trendline: The descending trendline currently hovering near $65,000 must be cleared with significant volume.
- Confront the 50-Day EMA: Only after clearing $66,913 can the market begin to look toward more optimistic price targets.
Ultimately, Bitcoin is in a "wait and see" phase. With the institutional bid from ETFs failing to materialize as it did in 2025, and with the macro environment defined by high interest rates and geopolitical uncertainty, the "permabull" narrative is currently being tested by the harsh realities of quantitative tightening. The market is at a crossroads, and for now, the data suggests that the bears have the upper hand.
Disclaimer: The views and opinions expressed in this article are for informational purposes only and do not constitute financial, investment, or other professional advice. Cryptocurrency investments involve significant risk; please conduct your own due diligence before making any financial decisions.