










The global cryptocurrency market has entered the second week of July in a state of profound trepidation. As the broader financial sector adjusts to shifting macroeconomic conditions, the digital asset space is grappling with a prolonged period of downward pressure, testing the resolve of even the most seasoned institutional investors.
For many, the current environment feels reminiscent of the "wash-out" phases that have historically preceded major market shifts. While Bitcoin and Ethereum struggle to find a stable footing, the overarching sentiment is one of caution, as both technical indicators and market participants align in a display of structural fatigue.
Main Facts: A Market Under Siege
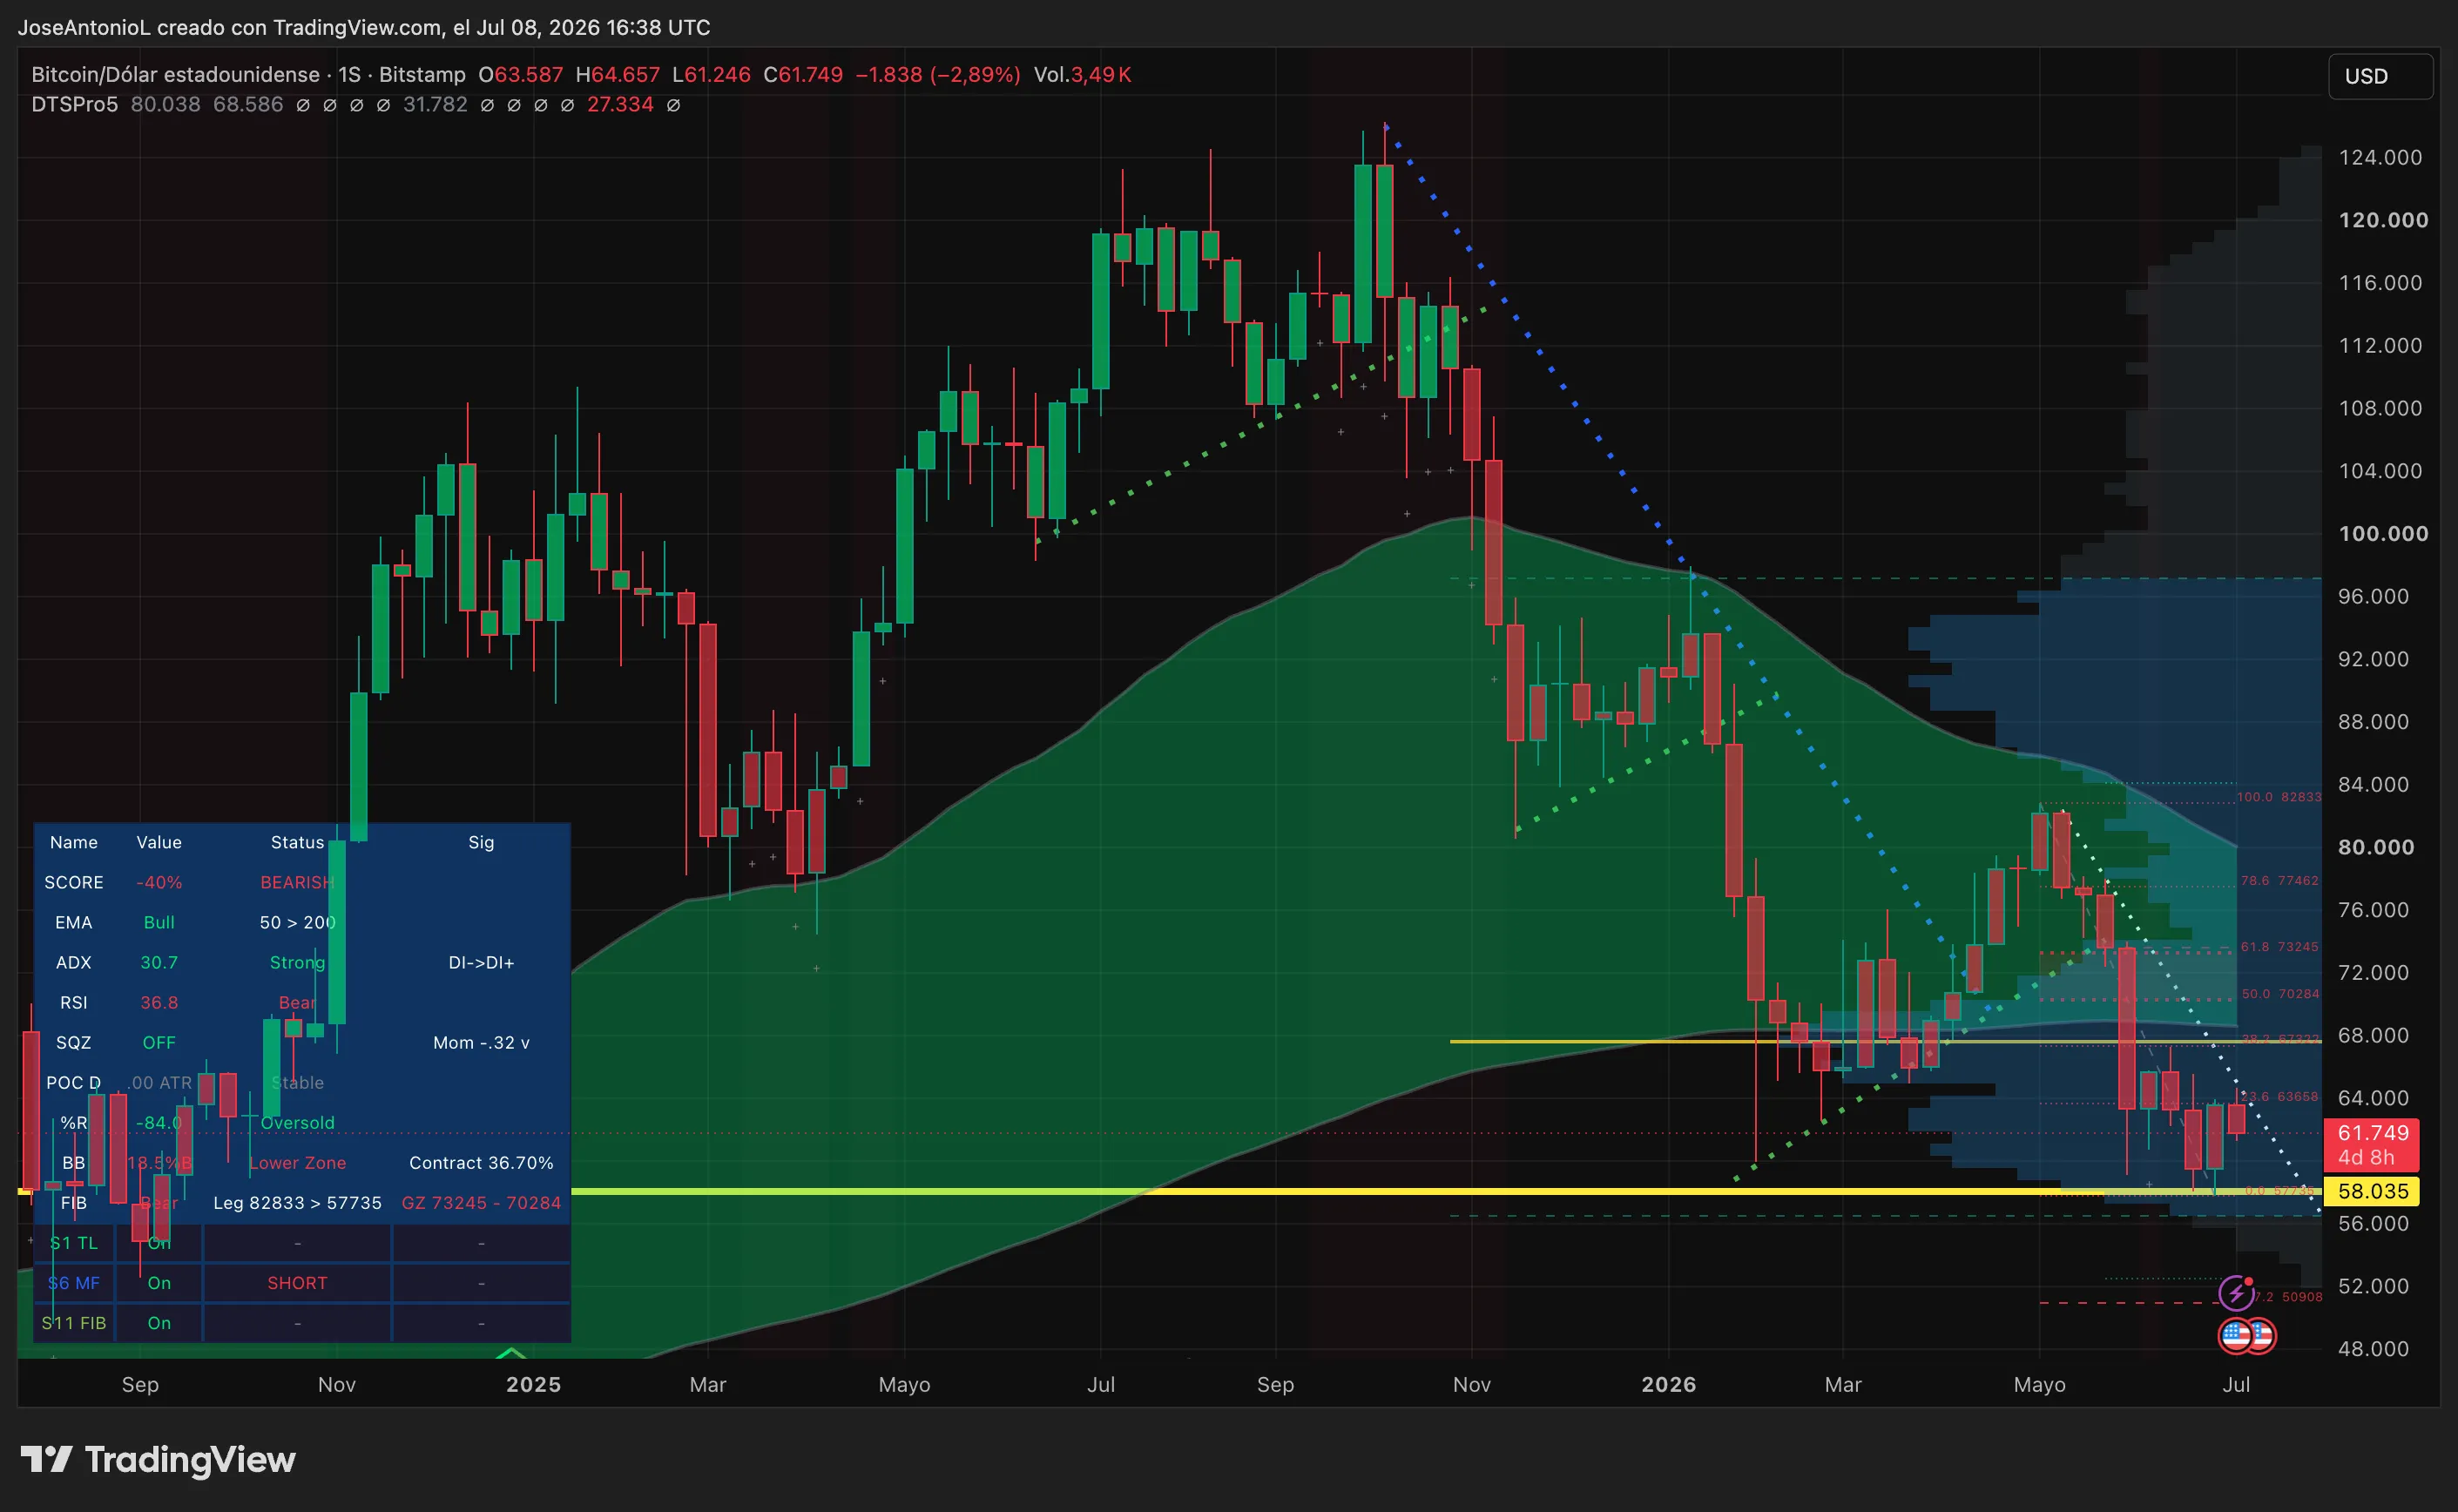
The current landscape is characterized by a "death by a thousand cuts" scenario. Bitcoin (BTC) is fighting to maintain its position in the low $60,000 range, having recently flirted with 21-month lows by briefly dipping below $58,000. This struggle for support has rippled across the ecosystem; Ethereum (ETH) is currently trading below $1,750, marking a roughly 4% decline in the immediate term and a staggering 30% loss over the past year.
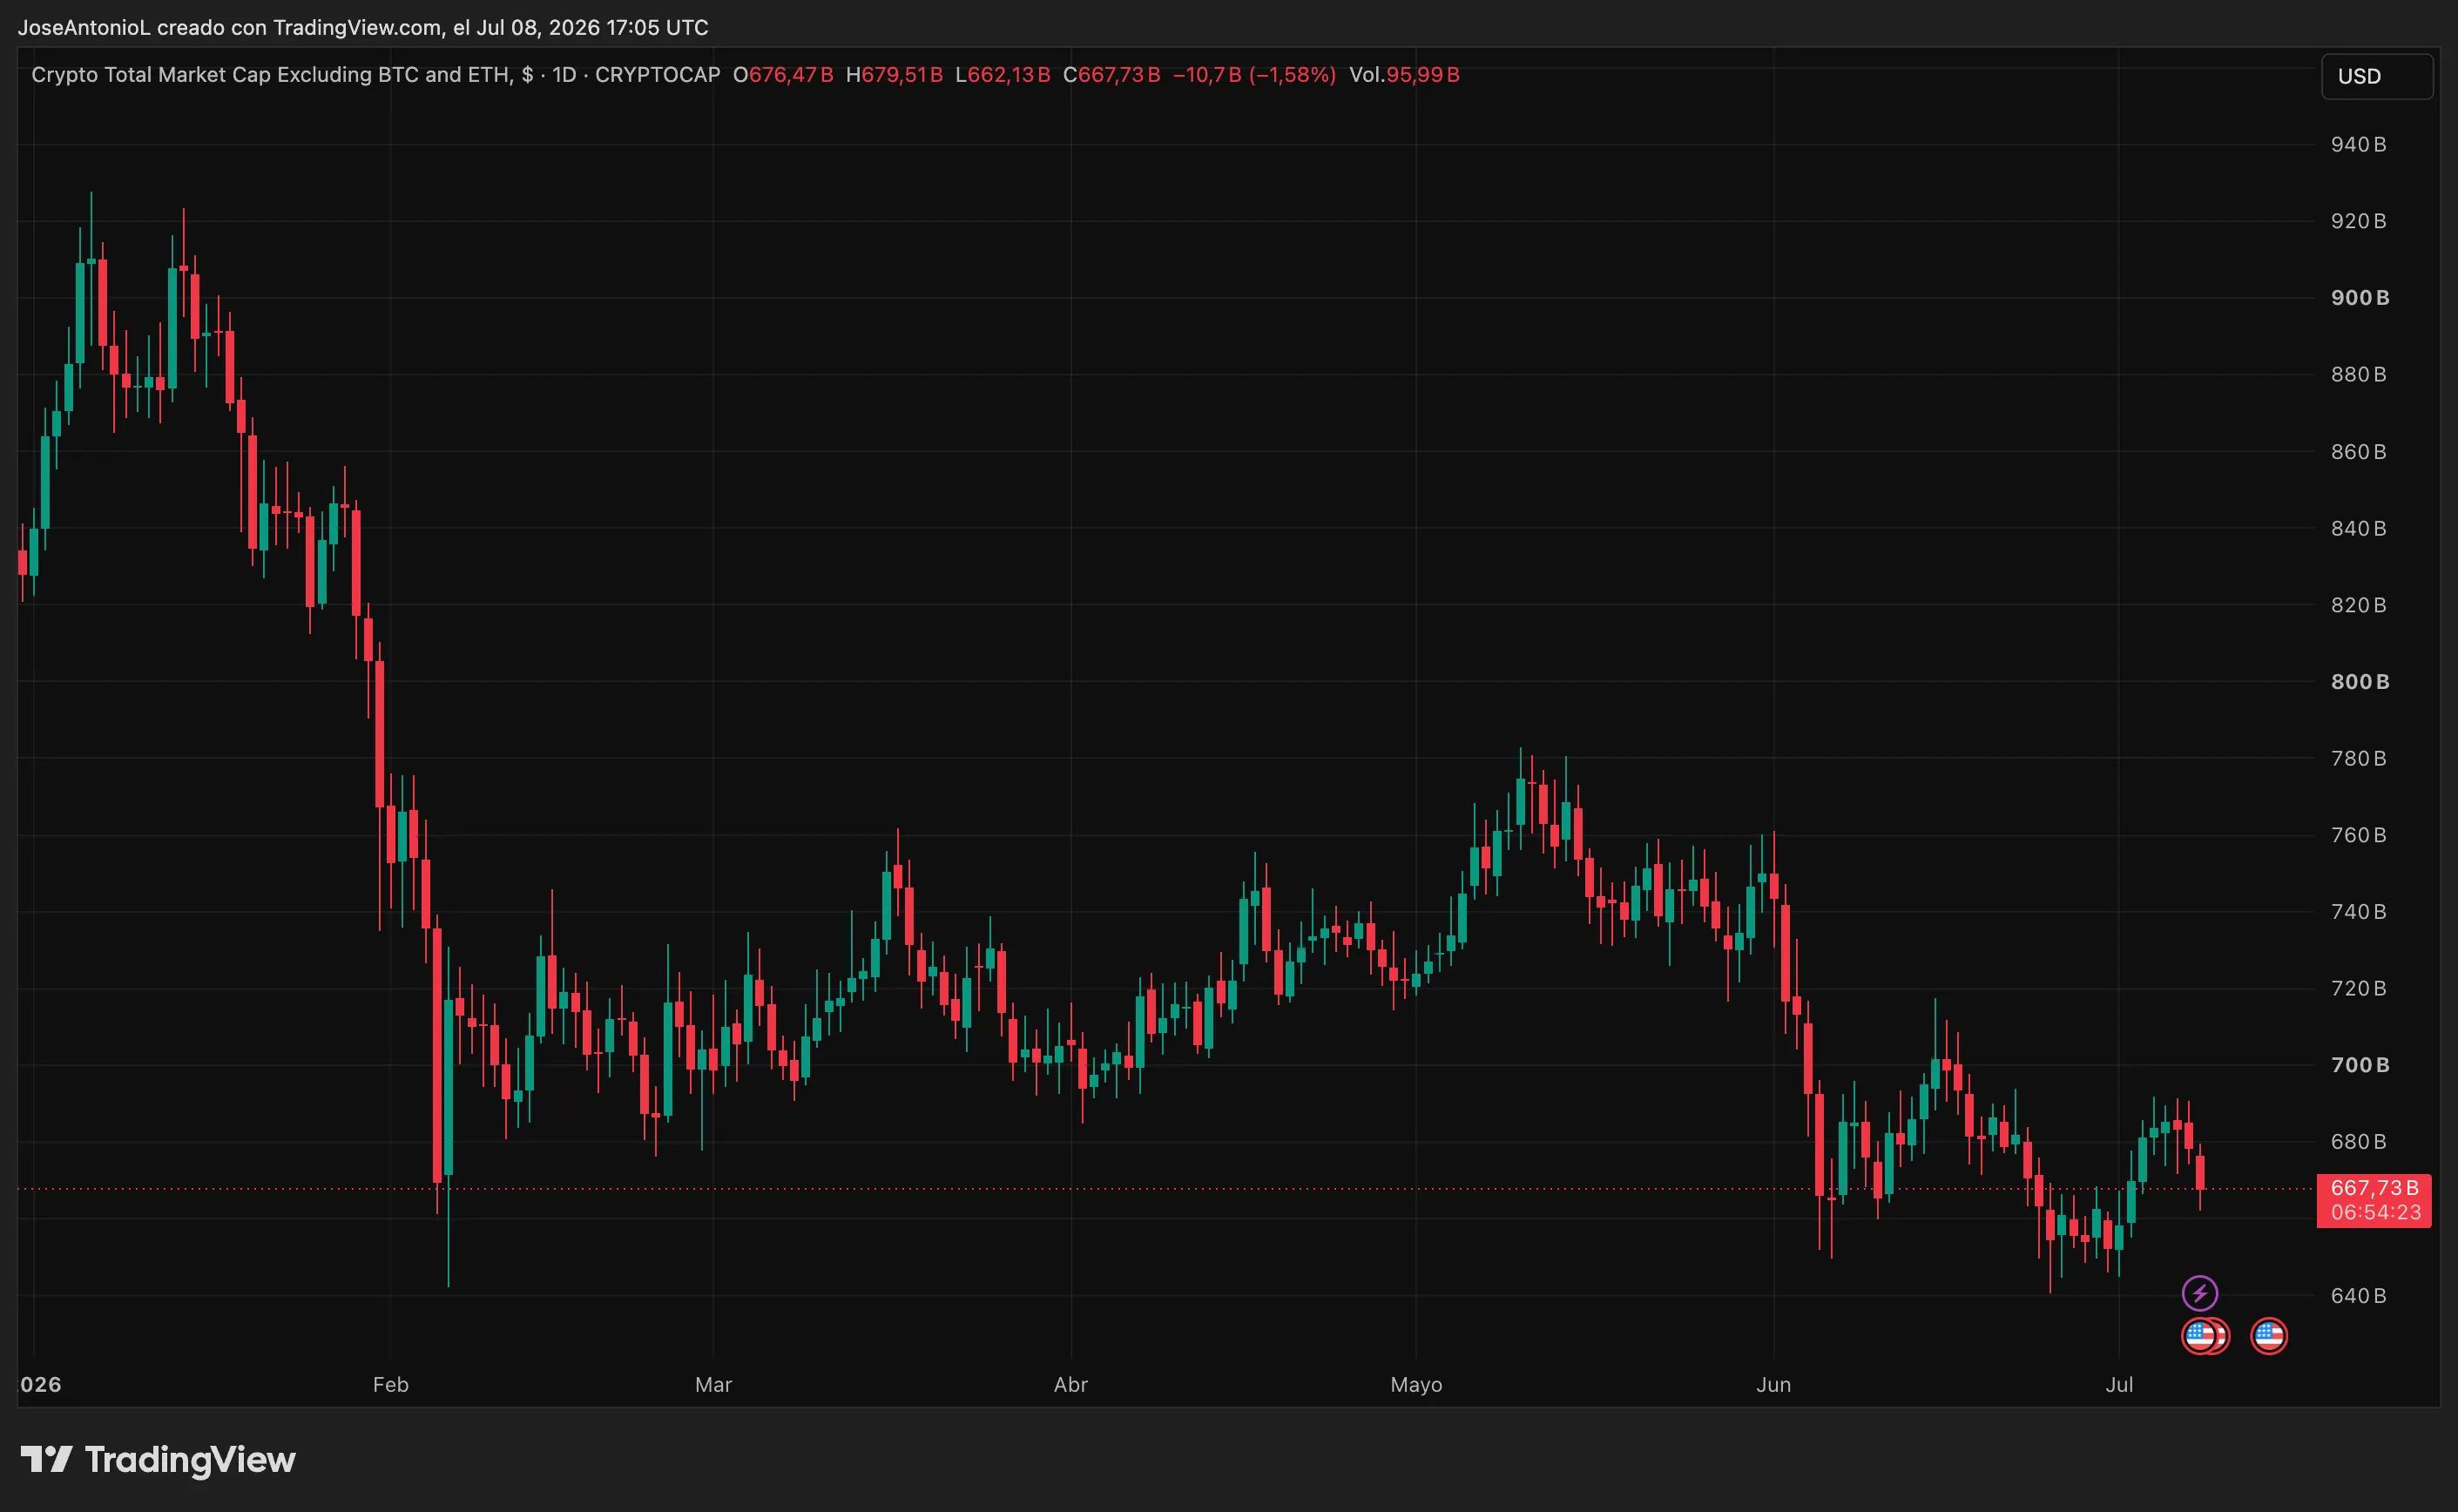
The carnage extends well beyond the two market leaders. Altcoins, which typically amplify the volatility of the top-tier assets, have faced even steeper corrections. Data indicates that the total crypto market capitalization—excluding Bitcoin and Ethereum—has shed 30% of its value since January. Perhaps most telling of the current disillusionment is the failure of the "IPO wave." High-profile entities such as Gemini, Bullish, and BitGo, once the darlings of the crypto-capital markets, have seen their valuation prospects implode since their respective debuts, signaling a drying up of liquidity and investor appetite for equity-based crypto exposure.
Chronology: The Road to the July Slump
To understand the current malaise, one must look at the recent trajectory of the market:

- May 2026: Ethereum’s daily chart confirmed a "death cross," signaling the start of a structural decline. Simultaneously, US spot ETH ETFs recorded a record 17-day streak of net outflows, totaling $401 million.
- June 2, 2026: Sentiment on prediction markets, such as Myriad, flipped. Where "smart money" had previously leaned bullish, the narrative shifted decisively toward a test of lower support levels.
- Early June 2026: The $64,000–$65,000 range solidified as a formidable resistance ceiling for Bitcoin. Every attempt to breach this level was met with immediate, forceful selling pressure.
- July 2, 2026: A glimmer of hope emerged as Spot Bitcoin ETFs snapped a grueling 10-day, $2.7 billion outflow streak, logging a single-day inflow of $221.7 million.
- The Present: Bitcoin hovers around $61,749, while Ethereum’s weekly chart has now confirmed its own death cross, suggesting that the bear market is not merely a short-term correction but a multi-month structural reality.
Supporting Data and Technical Analysis
The technical picture is, for the moment, decisively bearish. The Average Directional Index (ADX) for Bitcoin currently sits at 30.7. As a measure of trend strength, an ADX above 25 signifies a robust trend; given the current directional index, the trend is clearly downward.
The "Death Cross" Dilemma
For Ethereum, the situation is particularly acute. The 50-week exponential moving average (EMA) has crossed below the 200-week EMA. In financial analysis, a weekly death cross is a significant, long-term bearish signal that often defines the character of the market for months, if not years. While shorter-term death crosses can be "noise," a weekly confirmation typically implies that the trend is deeply entrenched.
Predictive Markets and Fibonacci Levels
Traders on Myriad, a decentralized prediction market, are currently pricing in a 72.3% probability that Bitcoin touches $55,000 before reaching $84,000. Similarly, the same platform suggests a 72% chance that Ethereum will test the $1,500 level before attempting a recovery to $3,000. Fibonacci retracement levels further support these targets; for Ethereum, the $1,500 zone represents a critical psychological and technical support line that, if breached, could invite further capitulation.
Institutional Perspectives and Official Responses
The institutional response to this downturn has been one of recalibration. Citi, for instance, recently slashed its 12-month Bitcoin price forecast to $82,000, while explicitly outlining a "bear case" at $53,000. This downgrade reflects the ongoing pressure caused by sustained ETF outflows throughout the spring and early summer.
However, the "mainstream" nature of this cycle adds a layer of complexity. Unlike previous eras, Bitcoin is no longer a niche hobbyist asset. With the integration of spot ETFs, formal accounting standard changes, and the emergence of nascent legislative frameworks, the players in this market are different. They are institutional allocators who operate on different time horizons and risk parameters than the retail traders of 2020.
While some analysts argue that this institutionalization brings stability, the current reality suggests it has merely changed the "suit" of the market participants without eliminating the inherent volatility of the asset class.
Implications: The Bullish Case for the "Patient"
Despite the grim headlines, history offers a contrarian perspective. Every major Bitcoin bear cycle since 2009 has concluded with a "flush"—a period of extreme fear and capitulation where the path of least resistance appears to be lower.
The Pre-Halving Compression
The next Bitcoin halving is roughly 21 months away. Historically, the period preceding this supply shock is defined by a "compression phase," where price grinds lower and sentiment deteriorates, shaking out weak hands before the next supply-side scarcity takes effect.
Fundamental Indicators
There are signs that the selling pressure may be approaching exhaustion:
- On-Chain Accumulation: Glassnode data indicates that long-term holders have returned to accumulation, suggesting that the "smart money" is beginning to view the current price points as value-oriented.
- ETF Inflows: The reversal of the 10-day outflow streak in early July suggests that institutional demand is still present, albeit fragile.
- The Fear & Greed Index: Currently sitting at 23, the market is in a state of "extreme fear." In financial history, such extreme readings have often served as a reliable contrarian signal, marking the final stages of a sell-off.
Conclusion: A Structural Shift
The crypto market is currently in a "wait and see" mode. The technicals suggest a downward bias, with clear magnets at $55,000 for BTC and $1,500 for ETH. However, the emergence of a structural weekly death cross on Ethereum and the ongoing, painful consolidation period for Bitcoin should not be viewed solely as a death knell. Instead, they represent the necessary, albeit uncomfortable, maturation of an asset class transitioning from speculative gambling to a recognized component of institutional portfolios.
The question remains: will the current "bearish consensus" hold, or will this be the moment where the obvious trade—going short—becomes the classic trap for the unprepared? As the market grinds through the summer, the data suggests that while the bottom may not be in, the exhaustion of sellers is finally within sight.
Disclaimer: The views and opinions expressed by the author are for informational purposes only and do not constitute financial, investment, or other advice. Cryptocurrency investments carry high risks; investors should conduct their own research before making financial decisions.