







Retail sales taxes remain the bedrock of state fiscal policy, functioning as a primary engine for public services across the United States. As of 2026, these levies account for approximately 32 percent of state tax collections and 13 percent of local tax receipts—representing a significant 24 percent of combined government revenue. While income taxes often dominate political discourse, economists frequently highlight sales taxes as more pro-growth, primarily because they minimize the economic distortions that can hamper investment and labor supply.
However, the landscape of sales tax in America is far from uniform. With 45 states imposing statewide levies and 38 permitting local jurisdictions to add their own, the total burden on consumers can vary drastically, sometimes shifting from a moderate state rate to an exceptionally high combined cost depending on a shopper’s specific ZIP code.
The State of Play: Combined Tax Burdens
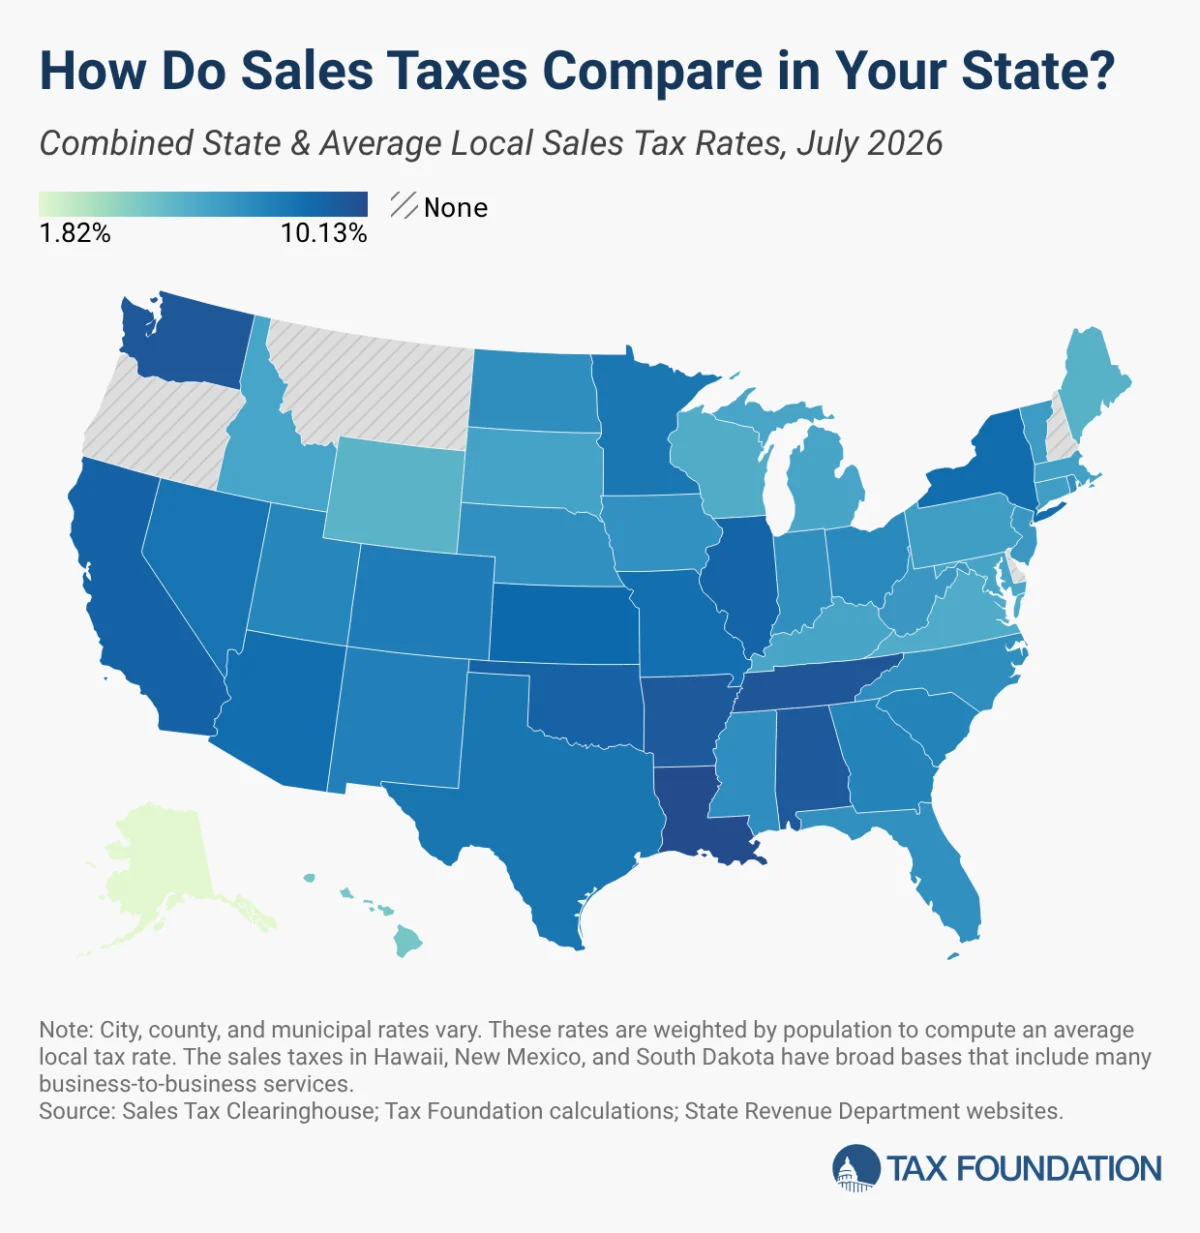
As of July 1, 2026, the tax map of the United States reveals a striking disparity. The five states with the highest average combined state and local sales tax rates are led by Louisiana, where the average burden sits at 10.13 percent. Tennessee follows closely at 9.61 percent, with Washington (9.57 percent), Arkansas (9.48 percent), and Alabama (9.46 percent) rounding out the top five.
Nationwide, the population-weighted average combined sales tax rate stands at 7.53 percent. While statewide rates remained largely static during the first half of 2026, the local level saw dynamic movement. North Carolina experienced a notable increase in its combined rate, shifting its national ranking by four places, while Georgia, California, and Vermont also saw upward adjustments. Conversely, Wyoming stands as a solitary outlier, having successfully reduced its combined rate due to several jurisdictions cutting local-option taxes throughout February and July.
A Chronological Perspective on Tax Reform
The path to the 2026 tax landscape has been marked by a series of legislative adjustments and fiscal pivots. The most significant recent shift at the state level occurred in Louisiana. In January 2025, the state raised its sales tax rate from 4.45 percent to 5 percent. This move was not an isolated tax grab, but a calculated component of a broader reform package that included the implementation of a 3 percent flat individual income tax, a 5.5 percent corporate income tax, the introduction of full expensing for business investments, and the repeal of the state’s franchise tax.
Prior to the 2025 Louisiana adjustments, other states experimented with downward pressure. South Dakota enacted a state sales tax cut in 2023, though this policy includes a "sunset" provision scheduled for June 2027. Similarly, New Mexico began a phased transition in July 2022, lowering its "gross receipts tax"—a hybrid levy that functions similarly to a sales tax but is assessed on businesses—from 5.125 percent to 4.875 percent. However, New Mexico’s fiscal policy includes a "trigger" mechanism: should revenue from the gross receipts tax fall below 95 percent of the previous year’s performance between 2026 and 2029, the rate is mandated to revert to the higher 5.125 percent level.
The absence of widespread state-level rate changes in the first half of 2026 suggests a shift in legislative priority. Lawmakers appear increasingly focused on income tax reduction, which is widely perceived as offering more immediate and substantial economic benefits to capital formation and labor productivity than adjustments to consumption-based taxes.
Supporting Data: Local Autonomy and Revenue Structures
The local layer of sales taxation is the most volatile variable in the American tax equation. Alabama holds the dubious distinction of having the highest average local sales tax rate in the country at 5.46 percent, followed by Louisiana (5.13 percent), Colorado (4.99 percent), Oklahoma (4.56 percent), and New York (4.54 percent).
These rates are often the result of "optional" local taxes designed to fund specific municipal needs, such as property tax relief. For instance, Georgia counties have utilized a "Floating Local Option Sales Tax," which allows them to raise rates by up to one percentage point for five-year increments specifically to offset property tax burdens.
Furthermore, states employ unique structural mechanisms that complicate simple comparisons:
- Mandatory Add-ons: California, Utah, and Virginia levy mandatory local-level taxes at the state level, which are typically folded into the "state rate" for ease of administration.
- The "Urban Enterprise" Exception: New Jersey utilizes "Urban Enterprise Zones," where specific businesses collect sales tax at exactly half the statewide rate (3.3125 percent). This creates a geographic "tax haven" within the state, often reflected as a negative adjustment in local rate averages.
- Broad-Based Systems: Hawaii, New Mexico, and South Dakota maintain "broad-based" systems that include business-to-business services. While this broadens the tax base, it also risks "tax pyramiding," where taxes are applied at every stage of production, potentially inflating the final price for consumers far more than a single-stage retail tax would.
Implications: Competition and Economic Behavior
The existence of high-tax and low-tax jurisdictions creates a "border effect" that fundamentally alters consumer and business behavior. When the gap between two neighboring jurisdictions becomes sufficiently large, tax avoidance becomes a primary driver of economic geography.
Research consistently shows that consumers "vote with their feet" to avoid sales tax. Chicago, with its high combined sales tax rate of 10.25 percent, serves as a textbook example; residents frequently cross municipal boundaries or move their purchasing activity to e-commerce platforms to bypass the high local levies.
The most stark evidence of this phenomenon is found in the New England region. The border between Vermont and New Hampshire serves as a natural laboratory for tax competition. While the I-91 highway corridor runs through Vermont, the New Hampshire side—which imposes no statewide sales tax—has seen a massive, decades-long migration of retail activity. Since the late 1950s, per capita retail sales in New Hampshire border counties have tripled, while their counterparts in Vermont have remained stagnant. Delaware, recognizing the economic development potential of this disparity, famously leveraged its "Home of Tax-Free Shopping" status to drive retail growth.
Expert Analysis: The "Right-Sized" Tax System
Tax policy experts generally advocate for a "right-sized" sales tax: one that applies to all final retail consumption but avoids taxing intermediate business inputs. By taxing business-to-business transactions, states inadvertently increase the cost of doing business, which ripples through the supply chain and results in higher prices for the end consumer.
Hawaii offers a cautionary tale regarding base breadth. While its tax base is the broadest in the nation, its structure leads to multiple layers of taxation on the same goods, eventually taxing roughly 119 percent of the state’s personal income. In contrast, the national median sees the sales tax applied to only 36 percent of personal income.
As states look toward the future, the challenge lies in modernizing their tax regimes to match the digital economy. The rise of remote work and the evolution of service-based consumption mean that old definitions of "taxable retail goods" are becoming obsolete. States that fail to align their tax bases with modern consumption patterns risk either losing revenue or imposing inefficient, arbitrary taxes that dampen economic growth.
Methodology and Limitations
The data presented here relies on quarterly reports from the Sales Tax Clearinghouse, weighted by Census population figures. This methodology provides a realistic view of what the "average" citizen experiences, rather than a simple mathematical average of all existing tax rates.
It is important to note that the use of "ZIP Code Tabulation Areas" (ZCTAs) introduces a minor degree of inexactitude, as some ZIP codes are strictly administrative and lack a residential population. However, by omitting these areas and relying on proximate residential data, the impact on the overall accuracy of state and local averages is negligible.
Ultimately, while sales tax rates serve as a primary indicator of a state’s fiscal stance, they are only one component of the broader tax mix. Policymakers must weigh the immediate revenue generated by sales taxes against the long-term potential for growth, the necessity of maintaining a competitive business climate, and the complex reality of local tax autonomy. In the evolving landscape of 2026, the states that manage to balance these factors—keeping rates competitive while broadening bases to include modern consumption—will be the best positioned for sustainable economic success.