









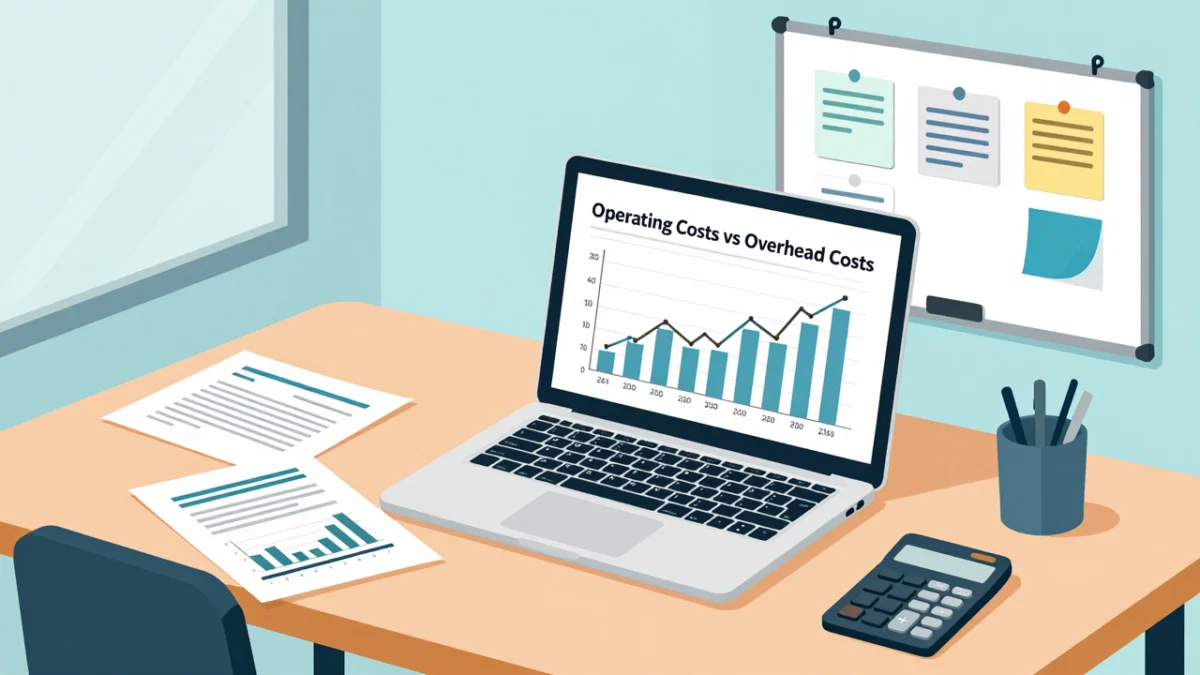
In the intricate landscape of modern business management, few skills are as critical—or as frequently misunderstood—as the ability to differentiate and control expenditure. As market pressures mount and economic volatility becomes the norm, business owners and corporate leaders are increasingly forced to scrutinize their financial statements. At the center of this scrutiny lie two fundamental categories of expenditure: overhead costs and operating costs.

While these terms are often used interchangeably in casual corporate discourse, confusing them can lead to flawed budgeting, inaccurate pricing strategies, and severely compromised profitability. Mastering the nuances of these financial metrics is no longer just an accounting exercise; it is a core competency required for sustainable enterprise growth.

Main Facts: Deconstructing the Cost Categories
To effectively manage a business’s bottom line, stakeholders must first understand the structural definitions that separate indirect expenses from direct production costs.

1. Overhead Costs (Indirect Expenses)
Overhead costs encompass all the ongoing, administrative, and fixed or semi-fixed expenses required to keep an enterprise operational, regardless of whether a single unit of product or service is generated.

- Characteristics: They do not vary directly with production volume. If a manufacturing plant halts operations for a week, rent, executive salaries, and insurance premiums must still be paid.
- Common Examples: Corporate office rent, municipal utilities (electricity, water, internet), legal fees, administrative salaries, and baseline marketing campaigns.
2. Operating Costs (Direct and Variable Expenses)
Operating costs, conversely, represent the outlays directly tied to the creation, production, and delivery of a company’s goods or services.

- Characteristics: These expenses fluctuate in direct correlation with production output. When manufacturing scales up, the consumption of raw materials and direct labor hours increases correspondingly; when production drops, these costs naturally contract.
- Common Examples: Raw materials, wages for production-line staff, equipment maintenance directly linked to fabrication, shipping fees, and sales commissions.
Understanding this divide allows management to pinpoint inefficiencies, establish accurate pricing models, and implement targeted cost-reduction initiatives without harming core productivity.

Chronology: The Evolution of Cost Management in Business Strategy
The methodology surrounding how businesses view and handle overhead versus operating costs has undergone a dramatic transformation over the past several decades.

- The Industrial Era (Mid-20th Century): Cost accounting was primarily focused on factory ledger systems. Direct labor and raw materials dominated the financial focus, while overhead was often lumped together as a generalized factory burden and allocated arbitrarily across products.
- The Rise of Lean Manufacturing (1980s–1990s): Driven by global competition, methodologies like Just-In-Time (JIT) manufacturing forced companies to look closely at waste. Operating costs were tightly optimized, but overhead began to creep upward due to expanding administrative layers and corporate infrastructure.
- The Digital Transformation and Remote Shift (2000s–Present): The proliferation of enterprise resource planning (ERP) software, automated accounting systems, and, more recently, the widespread adoption of remote and hybrid work models have fundamentally altered overhead structures. Physical real estate footprints have shrunk, transforming what was once considered a rigid, immovable overhead cost into a flexible variable that modern firms actively manage.
Supporting Data and Financial Benchmarks
Financial analysts rely on specific ratios to measure whether a company’s spending structure is healthy, sustainable, and competitive. Two critical benchmarks govern overhead and operating efficiency:

1. The Overhead Cost Ratio
The overhead cost ratio measures the proportion of indirect expenses relative to overall business revenue.

- The Benchmark: Financial experts generally advise companies to aim for an overhead cost ratio of under 35% of total revenue.
- Implication: If a business spends more than 35 cents of every earned dollar on indirect, non-productive functions (like excessive administrative bloat or premium office space), its competitive edge diminishes, leaving fewer resources available for R&D, expansion, or profit distribution.
2. The Operating Expense Ratio (OER)
The OER measures total operating expenses against total revenue, offering a panoramic view of overall operational efficiency.

- The Formula: $textTotal Operating Expenses div textTotal Revenue = textOER$
- The Benchmark: A healthy OER typically falls between 60% and 80%.
- Implication: For example, if a company generates $100,000 in revenue and incurs $60,000 in total operating expenses, its OER is 60%. Lower percentages within the 60%–80% window indicate superior resource utilization and stronger profit margins, while ratios approaching or exceeding 100% signal financial distress.
Summary Financial Comparison Table
| Metric / Feature | Overhead Costs | Operating Costs |
|---|---|---|
| Classification | Indirect Costs | Direct & Variable Expenses |
| Production Linkage | None; exists independently of output | High; fluctuates directly with output volume |
| Financial Statement Placement | Recorded under Operating Expenses (Income Statement) | Deducted from Gross Income to determine Net Income |
| Common Examples | Rent, administrative salaries, utilities | Raw materials, production wages, direct freight |
| Target Financial Benchmark | Below 35% of Total Revenue | OER between 60% and 80% |
Official Perspectives and Expert Responses
Corporate financial advisors and certified public accountants (CPAs) emphasize that treating all expenses uniformly is a primary trap for small-to-medium enterprises (SMEs) seeking scale.

According to leading financial consultants, the most dangerous misconception in corporate budgeting is the belief that "all operating costs are fixed." In official advisory roundtables, experts frequently point out that businesses fail to react swiftly during market downturns because they treat variable operating expenses as unchangeable fixtures.

Furthermore, industry thought leaders stress the importance of regular audits on financial statements. "A profit and loss statement is not a historical artifact to be filed away at tax time; it is a dynamic operational dashboard," notes one prominent financial strategist. "By continuously separating direct production outlays from administrative overhead, leaders can isolate precisely where margin compression is occurring—whether it is an uncompetitive supplier contract driving up direct costs or bloated office leases inflating indirect overhead."

Implications for Business Health and Strategic Planning
The implications of accurately managing overhead and operating costs ripple across every department of an organization, directly shaping long-term viability.

1. Pricing Strategy and Product Viability
If a business miscalculates its cost structure—such as mistakenly classifying marketing expenditures or administrative salaries as direct operating costs—its product pricing models will be skewed. Products may be underpriced, failing to absorb the true indirect costs required to keep the enterprise afloat, leading to volume growth that paradoxically accelerates financial loss.

2. Agility During Market Downturns
Companies that maintain a clear ledger distinction are inherently more agile. When revenues contract, understanding that overhead remains constant while operating costs naturally decline allows management to make precise cuts. Instead of blindly slashing budgets across the board—which often damages product quality and customer service—leaders can execute targeted reductions, such as renegotiating supplier terms, automating routine administrative tasks, or downsizing physical office footprints.

3. Enhancing Net Income and Shareholder Value
Ultimately, every dollar trimmed from an unnecessary overhead expense or optimized within an operating budget flows directly to the bottom line, enhancing net income. By enforcing strict adherence to target ratios (keeping overhead under 35% and operating ratios within the 60%–80% band), businesses fortify their balance sheets, secure better terms with institutional lenders, and build the financial resilience required to weather economic uncertainty.

Regular quarterly reviews of cost structures, coupled with proactive supplier negotiations and workflow automation, transform cost management from a reactive chore into a powerful strategic advantage.