








As of July 2026, the retail sales tax remains a cornerstone of American fiscal policy, serving as a primary revenue engine for state and local governments. Accounting for 32 percent of all state-level tax collections and 13 percent of local revenue, the sales tax is a dominant, if sometimes volatile, economic variable. While economists often favor sales taxes over income taxes for their relative neutrality and lower distortionary impact on investment, the reality of the American tax landscape is a patchwork of thousands of varying rates, exemptions, and local-option policies.
The Core Facts: A Nation of Divergent Rates
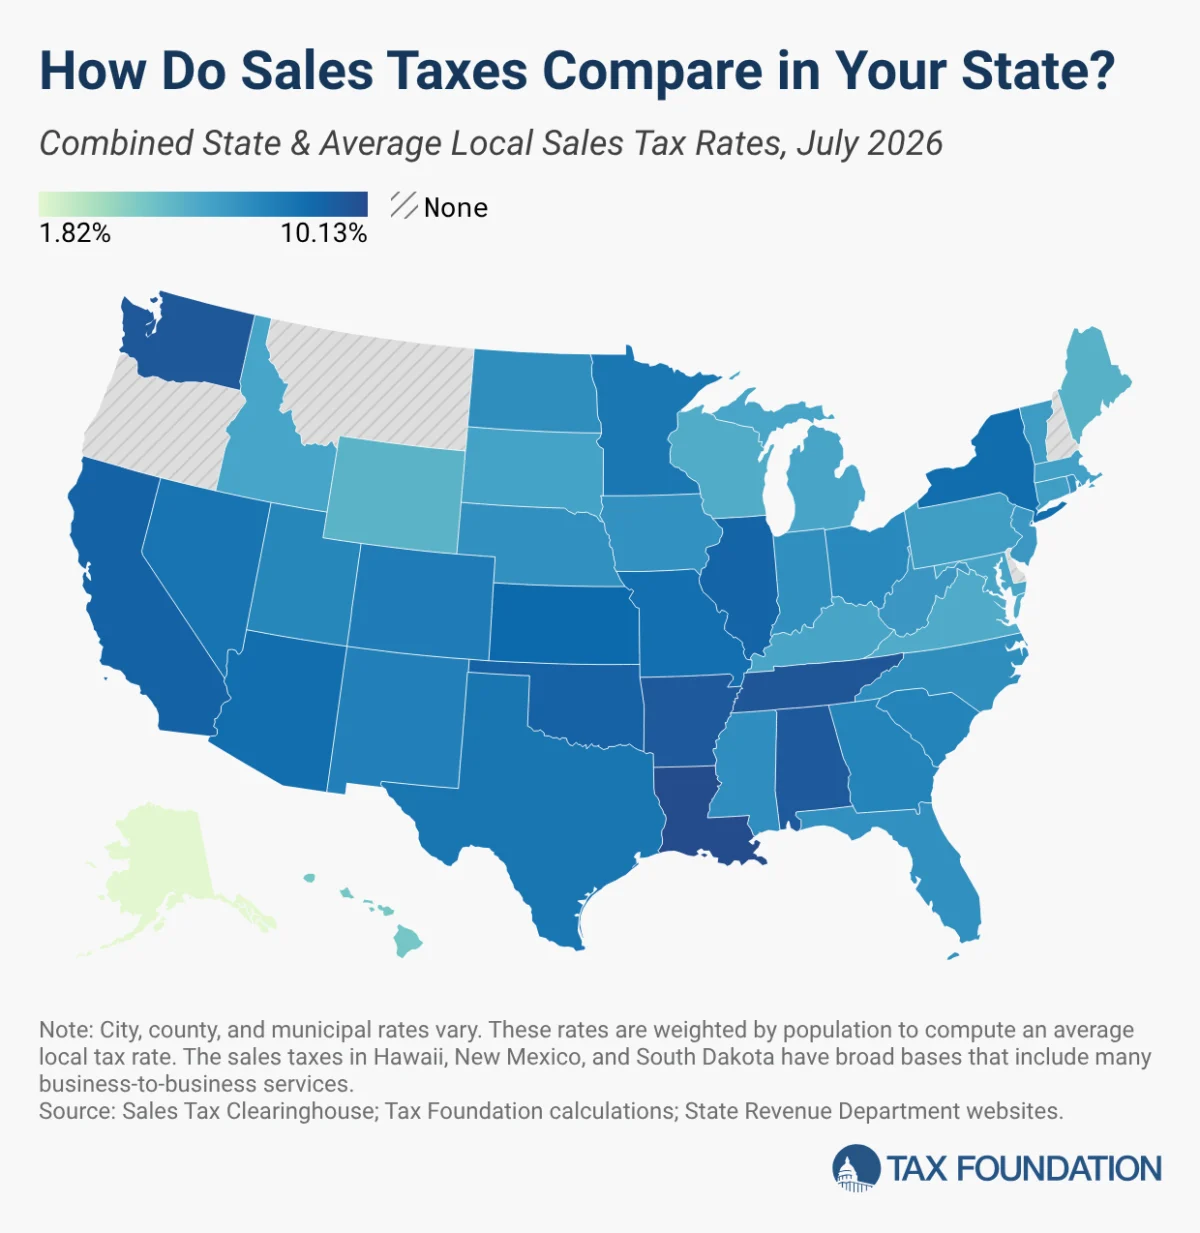
The structure of U.S. sales tax is defined by its decentralization. Forty-five states impose a statewide sales tax, while 38 states authorize local jurisdictions to levy their own additional rates. Even in states like Alaska, which eschews a statewide tax, local municipalities utilize sales taxes as their primary source of funding.
For the American consumer and business owner, the "sticker price" is rarely the final cost. Because local rates can be substantial—occasionally rivaling or even exceeding state-level percentages—the combined burden varies wildly across geographic lines. As of mid-2026, the five states with the highest average combined state and local sales tax rates are Louisiana (10.13 percent), Tennessee (9.61 percent), Washington (9.57 percent), Arkansas (9.48 percent), and Alabama (9.46 percent). Nationwide, the population-weighted average combined rate sits at 7.53 percent.
Chronology of Fiscal Shifts: 2025 to 2026
The period between early 2025 and July 2026 has been marked by a transition from aggressive rate-cutting to a period of consolidation and localized adjustment.
- January 2025: Louisiana implemented a significant tax reform package, raising its state sales tax rate from 4.45 percent to 5 percent. This increase was not an isolated move but part of a strategic trade-off, accompanying the introduction of a 3 percent flat individual income tax, a 5.5 percent corporate income tax, and the full repeal of the state’s franchise tax.
- July 2022 – 2023: Prior to the recent stability, states like South Dakota and New Mexico moved to lower their burdens. South Dakota enacted a rate cut in 2023, though it remains subject to a sunset provision in June 2027. New Mexico, meanwhile, reduced its "gross receipts tax" from 5.125 percent to 4.875 percent in 2022, with a "circuit breaker" mechanism that triggers a return to the higher rate if fiscal year revenues fall below a 95 percent threshold.
- January 1, 2026: A notable structural change occurred in Illinois, which eliminated its 1 percent state-level sales tax on food. However, the policy highlights the complexity of local autonomy, as many municipalities subsequently chose to implement their own local food taxes to recoup the lost revenue.
- Early 2026 to July 2026: The current year has seen no major statewide rate hikes. Instead, shifts have been marginal, driven by local option taxes. For instance, several Georgia counties utilized the "Floating Local Option Sales Tax," allowing them to levy an additional percentage point for up to five years specifically to provide property tax relief. During this same window, Wyoming stood out as the sole state to see a reduction in its combined rate, thanks to local jurisdictions paring back their optional tax rates.
Supporting Data: The Local Impact
While statewide rates grab headlines, the true impact on the consumer is often hidden in the local "add-ons." Alabama, despite having a moderate state-level rate, holds the title for the highest average local sales tax rate in the country at 5.46 percent. This highlights a critical, often misunderstood aspect of tax policy: a state with a "low" state tax rate may still be a high-tax environment if local governments are permitted to tax aggressively.
Comparative Table: Key Indicators (As of July 1, 2026)
| State | State Rate | Avg. Local Rate | Combined Rate |
|---|---|---|---|
| Louisiana | 5.00% | 5.13% | 10.13% |
| Tennessee | 7.00% | 2.61% | 9.61% |
| Washington | 6.50% | 3.07% | 9.57% |
| Arkansas | 6.50% | 2.98% | 9.48% |
| Alabama | 4.00% | 5.46% | 9.46% |
(Data derived from Sales Tax Clearinghouse and Tax Foundation calculations. Note: Local rates are population-weighted.)
Official Perspectives and Policy Implications
Policymakers face a delicate balancing act. Sales taxes are within their direct control and can be adjusted with relative speed, unlike the complex structural changes required for income tax reform. However, the "border effect" is a persistent reality. When jurisdictions increase their rates too far beyond their neighbors, they risk "tax flight."
The Border Problem
The New England corridor serves as a textbook study in fiscal competition. While Vermont maintains a sales tax, its neighbor, New Hampshire, does not. Research shows that per capita retail sales in New Hampshire border counties have tripled since the 1950s, while Vermont’s border counties have remained stagnant. Similar trends are observed in the Chicago metropolitan area, where consumers frequently cross into suburbs to avoid the city’s 10.25 percent combined rate.
The "Base" Equation
Tax experts emphasize that the rate is only half the story; the base—what is actually taxed—is equally important. Hawaii, for instance, maintains the broadest sales tax base in the U.S. While this allows for lower rates, it also leads to the "cascading" effect, where business-to-business transactions are taxed at multiple stages of production, ultimately inflating the final price for the consumer. Ideally, states should aim for a "right-sized" base that applies once to final retail goods, avoiding the inefficiency of taxing intermediate business inputs.
Strategic Conclusions
For taxpayers and business leaders, the 2026 tax landscape reveals three primary trends:
- Prioritization of Income Tax Cuts: Most state lawmakers are currently signaling that if they are to use their "fiscal capital," they prefer to cut income taxes rather than sales taxes, as the former is widely viewed as having a more direct, positive impact on economic growth and capital investment.
- The Local Revenue Trap: As states like Illinois remove statewide taxes on essentials like groceries, the reliance on local-option taxes is growing. This shifts the burden of tax policy from state capitols to town halls, making it increasingly difficult for residents to understand the total tax liability of their household.
- The Necessity of Modernization: As the economy shifts toward digital services and intangible goods, the "brick and mortar" sales tax model is becoming outdated. The most successful states in the coming years will likely be those that modernize their tax bases—moving away from the heavy taxation of business inputs and toward a more streamlined, consumption-based model that avoids the "tax-on-tax" scenarios currently seen in states like Hawaii.
In summary, while the sales tax is an efficient and reliable revenue stream, its lack of uniformity remains a drag on economic efficiency. As states continue to adjust their local rates to fund property tax relief and infrastructure, the disparity between neighboring jurisdictions will likely continue to influence business location decisions and consumer behavior for the foreseeable future.